Southeast Michigan Year-End 2021
Blog Search
Subscribe
Get the latest Michigan Housing Reports delivered straight to your inbox!

2021 Closed Sales
+5% from last year
2021 Avg Sale Price
+13% from last year
2021 Price Per SQ FT
+14% from last year
2021 Dollar Volume
+19% from last year
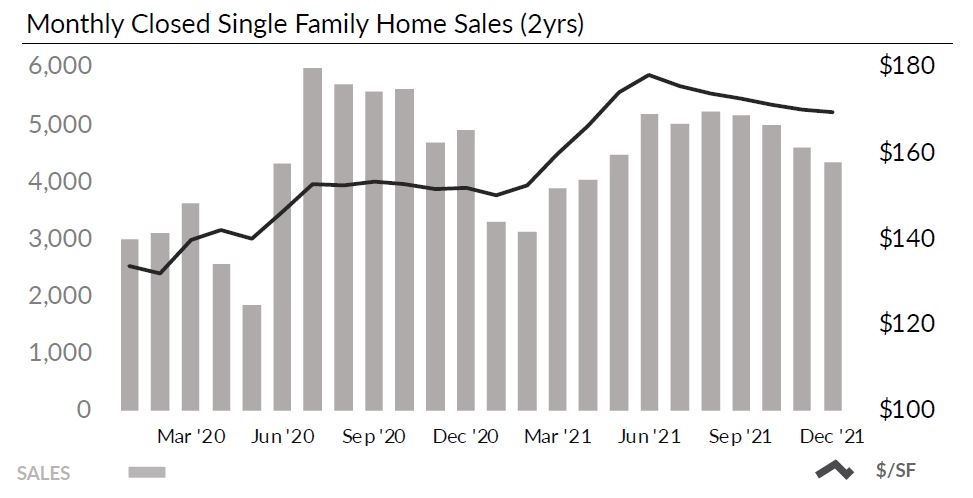
As seen in the chart above, both prices and sales were shot out of a cannon last spring. With more than half of all sales receiving multiple offers, average sale price jumped 17% from $265k in the first quarter to $309k in the second. Just as suddenly as the market took off, it settled in June. Buyers who had been hyper-focused on buying homes were distracted when they were suddenly able to resume the traditional life activities they had missed over the prior year. Although they tailed off slightly in the second half of the year, fourth quarter prices and demand remained strong as they carried over into 2022.
Annual 2021 sales were up 6% from 2020 and 7% compared to 2019. Tight inventory coupled with extreme demand drove prices up. Average sale price and price per square foot ended the year up 13% and 14% compared to 2020. Inventory shortages and a high level of carryover demand from buyers who couldn’t purchase a home last year have showing and new pending numbers running high early in 2022.

Market Rewards Well-Prepared Listings
< 1 minute
The Southeast Michigan housing market continues to settle into a healthier, more balanced pattern. Buyer activity remains strong, with new pendings rising 3% year-to-date despite new listings trailing last year [...]
Inventory Builds as Spring Market Takes Shape
< 1 minute
The Southeast Michigan housing market is moving into spring with many of the trends from earlier in the year still in place, now forming a clearer pattern. Compared to recent [...]
Growing Inventory Despite Fewer New Listings
2 minutes
Inventory continues to rise, even as fewer new listings are coming to market. Active listings are up 21% compared to a year ago, increasing from 5,300 to 6,500. At the [...]
©2026 Real Estate One. All rights reserved.